EXPLORE, LEARN, EXCEL with
The Clara James Approach
BLOG PAGE
Creative Resources for Primary Children

Linear Graphs GCSE
Recently a few people have asked about drawing linear graphs.
You might be asked to draw the graph x=3.
In which case you would start your line at number 3 on the x axis and draw straight up/ down.
A graph that asks for y=2, would require you to go to the 2 on the y axis and draw your line straight across.
In both examples it doesn’t matter how long your line it, it just needs to be a ‘sensible length’
You might, for example, be asked to draw the line y= 3x+2 from -3 to 3
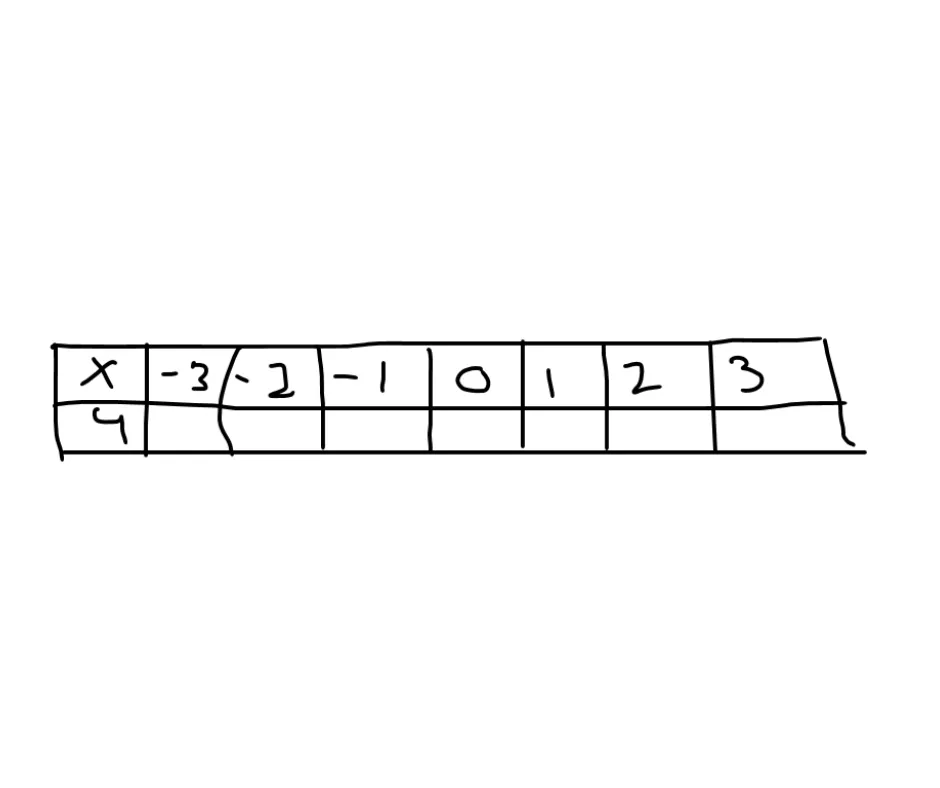
What I would now do is draw a table: (please be sure to use a ruler)

Now you take a value from the table (-3 would be the most logical) and insert it into the equation y=3x+2.
So now I have y= -3 x 3 + 2
-3x3=-9
-9+2 = -7
-7 now goes into the y column of the table under the -3.
You complete the whole table in the same way, so y = -2 x 3 + 2
-2 x 3 =-6
-6+2 = -4
Once the table is complete use your answers as the co-ordinates for the graph.
So the first point you’d plot is (-3, -7), the second point would be (-2, -4) and so on.
You may have to draw the axis, or they may have done it for you but either way, ensure that your graph is positioned so that it will hold all of your points. In this instance it will look like a cross rather than an L.
The other thing to be aware of is that the line must start at -3 and finish at 3 in this example because they have stated the length of the line. If it goes beyond that, they could knock marks off. (if it’s not stated it doesn't matter how long/ short your line is).
I hope this all makes sense but any questions, please do ask.
Each Thursday we send out an email to the parents of secondary school students, such as this one. If you would like to receive it, let me know: info@clarajamestutoring.co.uk you can unsubscribe at any time.
I hope they help
Stay Connected with Our Latest Stories and Updates!
Explore our blog for insightful articles, tips, and news to inspire and inform.
Whether you're seeking practical advice or simply a good read, our blog has something for everyone. Don't miss out on our fresh contents!
© Copyright 2022 The Clara James Approach

